When you play a SCORM course, there's a lot happening behind the scenes. And a lot of information is available in the debug log. You might never need to see it, but it may help troubleshoot.
Blackboard's Rustici SCORM engine gives you the ability to control Debugger Options. See https://help.blackboard.com/Learn/Instructor/Original/Course_Content/Create_Content/Add_Content_Packages#edit-the-scorm-player-advanced-options_OTP-4 for details.
Here's a screenshot of the Debugger Options:

However, Blackboard doesn't mention HOW to get to the debug log.
Wouldn't it be nice if there was a View Debug button that displayed the debug log? Like it does on the Rustici SCORM cloud.

Blackboard seems to have hidden the View Debug button on the player's Navigation bar by default, but even when I reveal it, clicking on the button doesn't work.
On https://support.scorm.com/hc/en-us/articles/206163696-Accessing-Debug-Logs-in-SCORM-Cloud Rustici actually mentions a "super sneaky way" to access the log.
You can:
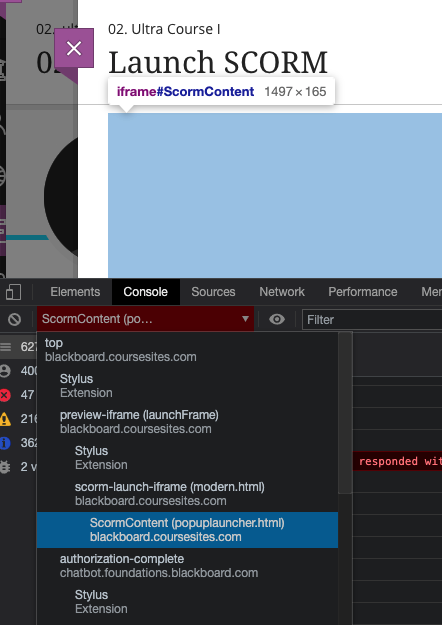
1) open the browser dev tools console
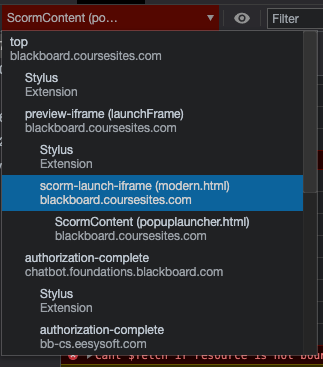
2) make sure the frame it’s referencing is the one that contains the player page (not the content)

This should bring up the window.
Note: be sure your browser allows pop-up windows from the site.

Does it work on all browsers?
Note: be sure your browser allows pop-up windows from the site.